Snoring is more than background noise; it can offer early clues about obstructive sleep apnea (OSA). Two acoustic markers stand out:
- Pitch (frequency) — the tone of the snore, measured in Hertz (Hz)
- Volume (intensity) — how loud it is, measured in decibels (dB)
Do either—or both—reliably flag OSA risk? Here’s what research says and how you can start gathering meaningful data at home.
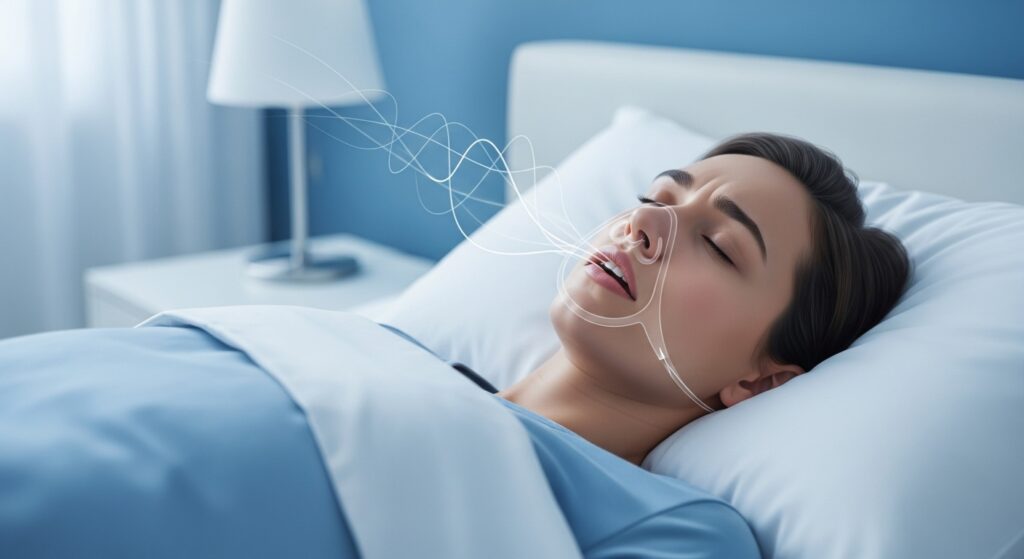
Anatomy of a Snore
When throat tissues sag during sleep, airflow rattles soft structures:
- Pitch depends on airway size (narrower passages = higher tones).
- Volume rises with faster airflow and heavier tissue vibration.
High‑pitched snores often stem from the soft palate; low, rumbling notes point to tongue‑base collapse.
Snore Pitch: The Frequency Factor
What Studies Reveal
An acoustic snore study found that tones above 500 Hz were linked to palatal flutter but did not always track with apnea severity. Conversely, a frequency‑spectrum analysis showed snores below 300 Hz often paired with higher apnea–hypopnea indices (AHI).
Takeaway: Lower‑frequency snores can signal deeper airway encroachment—a key OSA hallmark.
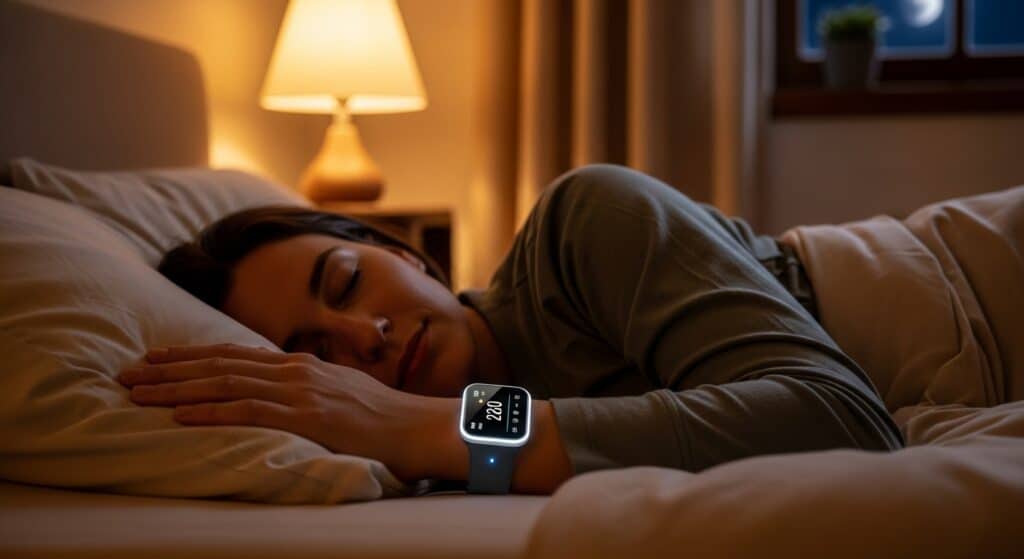
How to Measure Pitch at Home
- Use a smartphone app that creates overnight spectrograms.
- Log peak Hz clusters for at least seven nights.
- Compare low‑frequency bursts with how sleepy you feel in the morning.
Snore Volume: The Loudness Link
Evidence From Population Data
In a decibel‑tracked cohort of 1,200 adults, average snores above 60 dB tripled the odds of moderate‑to‑severe OSA versus < 45 dB. Volume alone, though, missed nearly one‑fifth of mild cases—room acoustics can amplify or dampen raw numbers.
Best Practices for Recording Volume
| Tip | Benefit |
| Place phone one metre from the sleeper | Avoids mic overload |
| Capture both weekday and weekend nights | Accounts for position changes |
| Note alcohol intake | Evening drinks can spike loudness |
Pitch and Volume Together: A Stronger Signal
A recent machine‑learning snore algorithm that blended pitch, volume, and pause length reached 87 % accuracy in predicting OSA on lab testing. The pattern that mattered most? Low‑pitch, high‑volume snores.
Confounding Factors to Watch
| Factor | Pitch Effect | Volume Effect |
| Back‑sleeping | Slightly lower | Louder |
| Nasal congestion | Higher | Variable |
| Evening alcohol | Lower | Louder |
| Hard surfaces | None | Echo boosts loudness |
Turning Snore Data Into Action
- Record two weeks of pitch and volume with an acoustic app.
- Add a STOP‑Bang questionnaire for a quick airway‑risk score.
- Run an AI facial scan to spot craniofacial markers tied to OSA.
- Share findings with a sleep physician, who may order a home sleep test.
Treatment Implications
- Low‑pitch, loud snores → often tongue‑base collapse; consider oral appliances or tongue‑stabilizing devices.
- High‑pitch palatal snores → respond well to positional therapy or palate‑strengthening exercises.
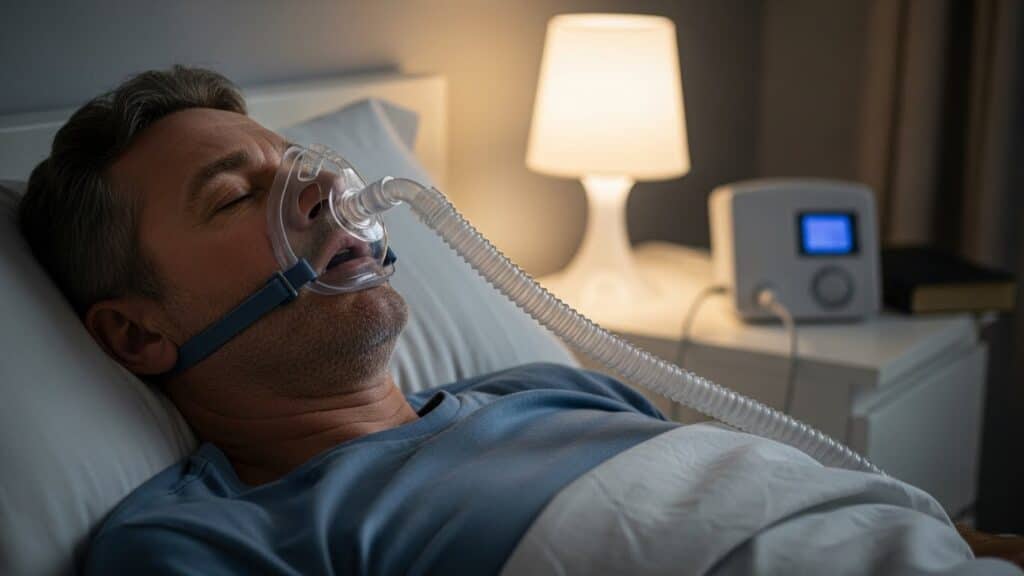
- Across severities, auto‑adjusting CPAP remains the top‑rated therapy when AHI ≥ 15.
Quiet‑Bedroom Tactics While You Wait for Testing
- Train yourself to side‑sleep with a body pillow.
- Limit alcohol within three hours of bed.
- Keep nasal passages clear—saline rinses or nasal strips reduce pitch spikes from congestion.
- Maintain bedroom humidity at 40–60 % to prevent tissue dryness and extra vibration.
When to Consult a Specialist
- Bed partner notices choking, gasping, or apneas.
- Your recordings average > 60 dB or cluster below 300 Hz.
- Daytime fatigue or headaches persist.
- STOP‑Bang score ≥ 3 or AI scan shows high facial‑risk markers.
A board‑certified sleep doctor can confirm apnea with a home sleep test or in‑lab polysomnography and craft a targeted treatment plan.
Key Takeaways
- Pitch and volume each offer partial clues; together they paint a clearer OSA picture.
- Low‑pitch, high‑volume snores often point to tongue‑base blockage and higher AHI.
- Room acoustics and body position can skew raw values—log data across multiple nights.
- Combining acoustic metrics with questionnaires and an AI facial scan boosts screening accuracy.
- Ongoing loud, low‑frequency snoring plus daytime sleepiness merit formal testing.
Ready for data‑driven answers? Start our free 60‑second AI scan and receive a personalised roadmap to quieter nights and better breathing.